
具体描述
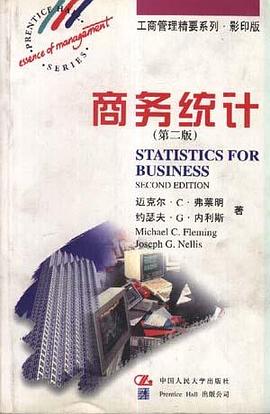
商业统计有何作用? 如何汇总统计数据? 什么是指数? 什么是统计测试? 什么是回归分析和相关分析?趋势变动和季节性变动应如何度量? 本书对上述问题及其他有关问题作了清楚而确切的解释。对于那些接受短期培训的管理者、MBA,以及想迅速了解这一问题核心内容的教师和学生来说,都不失为极具价值的参考书。它还可以作为管理人员的藏书,以及那些有抱负的管理人员完善自己知识和技能的参考资料。
作者简介
目录信息
1 The essence of statistics for business
The use of statistics
Basic terms and concepts
Statistics for managers
Schematic overview of the book
Statistical computer packages
2 Summarizing data using tables and graphs
The essence of descriptive tables and graphs in business
Tables and frequency distributions
Graphical methods of data presentation
Use of MINITAB
Key learning points
Exerdses
3 Summarizing data numerically
The essence of descriptive summary measures in business
Measures of location
Measures of dispersion
Use of MINITAB
Key leaming points
Exerdses
4 Index numbers
The essence of index numbers in business
Price index numbers
Quantity index numbers
Key learning points
Exerdses
5 Probability
The essence of probability in business
Assigning probabilities
The rules of probability
Expectations
Permutations and combinations
Key learning points
Exerdses
6 Probability distributions
The essence of probability distributions in business
The binomial distribution
The Poisson distribution
The normal distribution
Use of MINITAB
Key learning points
Exercises
7 Using samples to make estimates
The essence of statistical inference and estimation in business
Sampling distributions
Relationship between sample statistics and population parameters
Point estimation of the population mean
The size and measurement of the standard error of the mean
The probability of error
Interval estimation of the population mean
The measurement of the standard error of the mean when cr
is unknown
Sampling and the t distribution
Use of MINITAB
Key leaming points
Exerdses
8 Tests of statistical hypotheses
The essence of statistical inference and testing hypotheses in
business
The basic principles of hypothesis testing
Conducting hypothesis tests
Errors in hypothesis testing: Type 1 and Type 11 errors
Extensions of hypothesis testing
Use of MINITAB
Key learning points
Exercises
9 Tests of goodness-of-fit and independence
The essence of tests of goodness-of-fit and independence in
business
Goodness-of-fit tests
Tests of independence
Use of MINITAB
Key learning points
Exercises
10 Simple regression and correlation analysis
The essence of simple regression and correlation in business
Simple regression analysis
Simple correlation analysis
Extensions of simple regression and correlation analysis
Use of MINITAB
Key learning points
Exerdses
11 Multiple regression and correlation analysis
The essence of multiple regression and correlation in business
Multiple regression analysis
Multiple correlation analysis
Pitfalls and limitations of multiple regression analysis
Use of MINITAB
Key learning points
Exercises
12 Analyzing time series data
The essence of time series analysis in business
Measurement of trend (T)
Measurement of seasonal variation (S)
Measurement of cyclical variation (C)
Random variation (R)
Key learning points
Exercises
Appendix A Probability distribution tables
Al Binomial probability distribution
A2 Poisson probability distribution
A3 Standard normal distribution
A4 t distribution
A5 x distribution
A6 F distribution
Appendix B Computer software for statistical analysis
Appendix C Sources of business and economic statistics
Appendix D References for further reading
Solutions to exercises
Index
· · · · · · (收起)
读后感
用户评价
这本书的排版和印刷质量相当不错,纸张也比较厚实,看久了眼睛不容易疲劳,这是作为实体书一个很大的加分项。作者在某些章节试图用一些商业案例来佐证统计原理,比如零售业的库存管理或者市场调研的满意度分析,这些部分是我最期待的。然而,这些案例的设置似乎有些理想化,数据都非常“干净”,结果也总是能完美地支持某个统计假设的成立。我印象最深的是关于时间序列分析的那一章,它用一个季度销售额的例子来讲解移动平均法,过程清晰流畅,但现实中,哪有这么完美的季节性和趋势性数据?真正的数据往往是充满了异常值和缺失值的。我希望作者能多加入一些“反面教材”,比如数据异常如何影响回归线的拟合,或者在实际数据采集过程中常见的偏差是如何产生的,并提供应对策略。现在读起来,感觉像是在阅读一个完美的数学模型演示,而不是面对一个充满挑战的真实商业环境。这本书的理论框架很稳固,但“野路子”的实战经验几乎没有。
这本书的特点是它的结构化程度极高,每一章的逻辑递进都非常清晰,让你能感受到作者在编排内容时的深思熟虑。但这种过度的结构化也带来了一种僵硬感。例如,当讲解到卡方检验时,作者详细列举了所有可能出现的检验值和自由度的计算,但对于“为什么我们选择卡方检验而不是其他检验”的内在逻辑,解释得不够深入。我更倾向于那种能激发我思考“为什么”而不是仅仅告诉我“怎么做”的书籍。读完后,我能熟练地套用公式进行计算,但当我面对一个全新的业务问题时,我可能无法迅速地从这堆工具中辨识出哪个才是最匹配的利器。这本书更像是地图,清晰地标示了所有已知的路标,但没有提供深入丛林探索的指南针。它要求读者被动接受知识的灌输,而不是主动参与知识的构建过程,读起来缺乏那种醍醐灌顶的“顿悟感”。
这本《商业统计(第二版)》真是让我这个非科班出身的文科生头疼不已。我原本以为统计学不过就是那点儿平均数、中位数和方差,顶多再加个简单的回归分析,没想到翻开这书,简直像掉进了一个满是希腊字母和复杂公式的迷宫。一开始的描述性统计部分还算友好,图表画得挺清晰,能大致明白数据分布的形状。但是,一旦进入概率论和抽样分布那一块,我就开始抓瞎了。作者似乎默认读者都有扎实的微积分基础,各种推导过程看得我云里高山,很多定理的证明部分我直接跳过了,生怕越看越懵。感觉这本书更适合那种准备考研或者打算在量化分析领域深耕的读者,对于我这种只想了解商业决策中如何运用基本统计工具的“小白”来说,门槛实在太高了。比如讲到中心极限定理时,书里用了大篇幅的数学论证,而我真正想知道的是,在实际业务中,我应该如何根据样本量来判断我的结论可靠性,书里给出的建议太抽象,缺乏具体的案例支撑,总觉得理论和实践之间隔着一道鸿沟,读起来非常费力,只能对照着网上的视频教程才能勉强跟上节奏。
拿到这本《商业统计(第二版)》,我最大的感受是它的内容组织非常严谨,学术味儿十足,但对于实际操作的指导性似乎有所欠缺。它更像是一本教科书而非工具书。书中对每一个统计概念的定义都力求精确无误,从假设检验的每一步流程到方差分析的模型设定,都写得面面俱到。我尤其欣赏它在讨论统计推断的局限性时所花的心思,强调了“相关不等于因果”的重要性,这对于警示那些轻易下结论的管理者是非常有益的。然而,在如何选择合适的统计软件进行分析这一块,书里提及甚少。它会告诉你应该用t检验,但不会详细告诉你如何在Excel或SPSS里点哪几个按钮来实现,甚至连数据清洗和预处理的基本常识也一带而过。这就导致我学完理论知识后,面对真实世界那些“脏数据”时,仍然感到束手无策,知识的应用转化率不高,读完后感觉自己像个理论大师,但依然无法独立完成一份完整的统计报告。这本书的深度毋庸置疑,但它的“宽度”和“应用性”似乎被牺牲了。
我对这本书的评价是,它非常适合作为统计学专业学生的第一本入门教材,但对于已经有一定基础,想深入研究更高级模型(比如非参数检验、多元回归的高级诊断)的读者来说,深度略显不足。它覆盖了商业统计的“经典”内容,例如描述统计、参数估计、基本假设检验、简单线性回归和方差分析,这些都是基础中的基础。但当我试图寻找关于贝叶斯统计方法的介绍时,发现这方面的内容基本缺失,这在当前数据科学快速发展的背景下,是一个明显的短板。此外,书中对现代统计学中越来越重要的“稳健性”概念讨论得不够充分,似乎对经典方法的依赖性过强。虽然书名是“第二版”,意味着有更新,但整体的视野和方法论上,还是停留在相对传统的频率学派框架内,未能充分体现近年大数据和机器学习对统计思维带来的冲击和融合,读起来稍显过时,缺少了对未来趋势的把握。