
具体描述
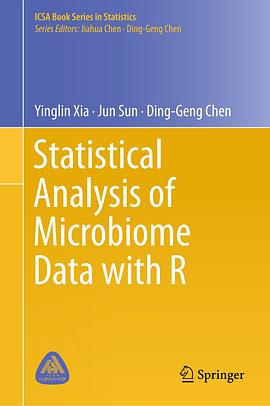
In this book, the authors aim to provide the step-by-step procedures to perform data analysis of microbiome data by way of the R programming language. The book provides some bioinformatic and statistical foundations of data analysis because microbiome data are complicated and analysis of microbiome data is still very challenging. To strike a balance, authors briefly introduce concepts, backgrounds, statistical method developments in the beginning three chapters before illustrating the applications in real data (Chap. 4-12).
作者简介
Dr. Yinglin Xia is a Research Associate Professor at the Department of Medicine, the University of Illinois at Chicago, USA. He was a R esearch Assistant Professor in the Department of Biostatistics and Computational Biology at the University of Rochester, Rochester, NY. Dr. Xia has worked on a variety of research projects and clinical trials in microbiome, gastroenterology, oncology, immunology, psychiatry, sleep, neuroscience, HIV, mental health, public health, social and behavioral sciences, as well as nursing caregiver. He has published more than 100 papers in peer-reviewed journals on Statistical Methodology, Clinical Trial, Medical Statistics, Biomedical Sciences, and Social and Behavioral sciences. He serves the editorial board of 9 scientific journals. Dr. Xia is well versed in the design and analysis in the areas of longitudinal data, mediation and moderation analyses, multilevel clustered-data, zero-inflated count data, mixed-effects model, GEE, structural equation model, meta-analysis, and ROC curve. He has successfully applied his statistical knowledge, modeling and programming skills to study designs and data analysis in biomedical research and clinical trials. He has been involved as a co-investigator or statistician in numerous NIH, CDC, and other grants. Three grants he designed on microbiome studies were funded by NIH and other funding agencies. His recent papers on microbiome data analysis are well received by peers.
Dr. Jun Sun is a tenured Professor of Medicine at the University of Illinois at Chicago, USA. She is an elected fellow of American Gastroenterological Associate (AGA). Her research interests are host–microbiome interactions in inflammation and cancer. Her key achievements include (1) characterization of vitamin D receptor regulation of gut microbiome in intestinal homeostasis and inflammation, (2) identification of dysbiosis and intestinal dysfunction in amyotrophic lateral sclerosis (ALS), (3) characterization of bacteria in regulating intestinal stem cells, and (4) identification and characterization of the Salmonella effector protein AvrA in host–bacterial interactions. Dr. Sun has published over 160 scientific articles in peer-reviewed journals, including Gut, Cell Stem Cells, Nature Genetics, JBC, American Journal of Pathology, American Journal of Physiology-GI. She is the leading editor of three books, including a recent Nature/Springer book entitled Mechanisms Underlying Host-Microbiome Interactions in Pathophysiology of Human Diseases. This book has shown a novel theme and multiple disciplinary topics of microbiome research for broad audience. She is in the editorial board of more than 10 peer-reviewed international scientific journals. She services study sections for the NIH, American Cancer Society, and other national and international research foundations. She is the Chair-elected for the AGA microbiome section. Her research is supported by the NIH, DOD, and other research awards. Dr. Sun is a believer of scientific art and artistic science. She enjoys writing her science papers in English and poems in Chinese. She teaches her medical fellows biomedical knowledge and also the way to translate the Chinese poems. In addition to her research papers and books, her poetry collection《让时间停留在这一刻》“Let time stay still at this moment”, is published in January 2018 by Chinese Literature and History Press.
Prof. Ding-Geng Chen is a fellow of the American Statistical Association and currently the Wallace Kuralt distinguished Professor at the University of North Carolina at Chapel Hill, USA and an extraordinary Professor at University of Pretoria, South Africa. He was a Professor at the University of Rochester and the Karl E. Peace endowed eminent scholar chair in biostatistics at Georgia Southern University. He is also a senior consultant for biopharmaceuticals and government agencies with extensive expertise in clinical trial biostatistics and public health statistics. Professor Chen has written more than 150 referred publications and co-authored/co-edited 23 books on biostatistical clinical trial methodology, meta-analysis, causal-inference and data analytics, and public health statistics.
目录信息
1.1 Introduction to Microbiome Study . . . . . . . . . . . . . . . . . . . . . . 1
1.1.1 What Is the Human Microbiome? . . . . . . . . . . . . . . . . 1
1.1.2 Microbiome Research and DNA Sequencing . . . . . . . . 2
1.2 Introduction to Phylogenetics. . . . . . . . . . . . . . . . . . . . . . . . . . 4
1.3 16S rRNA Sequencing Approach . . . . . . . . . . . . . . . . . . . . . . . 5
1.3.1 The Advantages of 16S rRNA Sequencing . . . . . . . . . 5
1.3.2 Bioinformatic Analysis of 16S rRNA Sequencing
Data . . . . . . . . . . . . . . . . . . . . . . . . . . . . . . . . . . . . . 7
1.4 Shotgun Metagenomic Sequencing Approach . . . . . . . . . . . . . . 12
1.4.1 Definition of Metagenomics . . . . . . . . . . . . . . . . . . . . 12
1.4.2 Advantages of Shotgun Metagenomic Sequencing . . . . 13
1.4.3 Bioinformatic Analysis of Shotgun Metagenomic
Data . . . . . . . . . . . . . . . . . . . . . . . . . . . . . . . . . . . . . 14
1.5 Bioinformatics Data Analysis Tools . . . . . . . . . . . . . . . . . . . . . 18
1.5.1 QIIME . . . . . . . . . . . . . . . . . . . . . . . . . . . . . . . . . . . . 19
1.5.2 mothur . . . . . . . . . . . . . . . . . . . . . . . . . . . . . . . . . . . . 19
1.5.3 Analyzing 16S rRNA Sequence Data Using QIIME
and Mothur . . . . . . . . . . . . . . . . . . . . . . . . . . . . . . . . 20
1.6 Summary . . . . . . . . . . . . . . . . . . . . . . . . . . . . . . . . . . . . . . . . 21
References . . . . . . . . . . . . . . . . . . . . . . . . . . . . . . . . . . . . . . . . . . . . 21
2 What Are Microbiome Data? . . . . . . . . . . . . . . . . . . . . . . . . . . . . . 29
2.1 Microbiome Data . . . . . . . . . . . . . . . . . . . . . . . . . . . . . . . . . . 29
2.2 Microbiome Data Structure . . . . . . . . . . . . . . . . . . . . . . . . . . . 30
2.2.1 Microbiome Data Are Structured as a Phylogenetic
Tree. . . . . . . . . . . . . . . . . . . . . . . . . . . . . . . . . . . . . . 30
2.2.2 Feature-by-Sample Contingency Table . . . . . . . . . . . . . 30
2.2.3 OTU Table . . . . . . . . . . . . . . . . . . . . . . . . . . . . . . . . 31
2.2.4 Taxa Count Table. . . . . . . . . . . . . . . . . . . . . . . . . . . . 31
2.2.5 Taxa Percent Table . . . . . . . . . . . . . . . . . . . . . . . . . . . 32
2.3 Features of Microbiome Data . . . . . . . . . . . . . . . . . . . . . . . . . 32
2.3.1 Microbiome Data Are Compositional. . . . . . . . . . . . . . 34
2.3.2 Microbiome Data Are High Dimensional and
Underdetermined . . . . . . . . . . . . . . . . . . . . . . . . . . . . 34
2.3.3 Microbiome Data Are Over-Dispersed . . . . . . . . . . . . . 36
2.3.4 Microbiome Data Are Often Sparse
with Many Zeros . . . . . . . . . . . . . . . . . . . . . . . . . . . . 36
2.4 An Example of Over-Dispersed and Zero-Inflated
Microbiome Data . . . . . . . . . . . . . . . . . . . . . . . . . . . . . . . . . . 37
2.5 Challenges of Modeling Microbiome Data . . . . . . . . . . . . . . . . 38
2.6 Summary . . . . . . . . . . . . . . . . . . . . . . . . . . . . . . . . . . . . . . . . 39
References . . . . . . . . . . . . . . . . . . . . . . . . . . . . . . . . . . . . . . . . . . . . 40
3 Introductory Overview of Statistical Analysis of Microbiome
Data . . . . . . . . . . . . . . . . . . . . . . . . . . . . . . . . . . . . . . . . . . . . . . . . 43
3.1 Research Themes and Statistical Hypotheses in Human
Microbiome Studies . . . . . . . . . . . . . . . . . . . . . . . . . . . . . . . . 43
3.2 Classic Statistical Methods and Models in Microbiome
Studies . . . . . . . . . . . . . . . . . . . . . . . . . . . . . . . . . . . . . . . . . . 45
3.2.1 Classic Statistical Tests . . . . . . . . . . . . . . . . . . . . . . . . 45
3.2.2 Multivariate Statistical Tools . . . . . . . . . . . . . . . . . . . . 46
3.2.3 Over-Dispersed and Zero-Inflated Models . . . . . . . . . . 47
3.3 Newly Developed Multivariate Statistical Methods . . . . . . . . . . 48
3.3.1 Dirichlet-Multinomial Model . . . . . . . . . . . . . . . . . . . . 48
3.3.2 UniFrac Distance Metric Family . . . . . . . . . . . . . . . . . 49
3.3.3 Multivariate Bayesian Models . . . . . . . . . . . . . . . . . . . 50
3.3.4 Phylogenetic LASSO and Microbiome . . . . . . . . . . . . 51
3.4 Compositional Analysis of Microbiome Data . . . . . . . . . . . . . . 52
3.5 Longitudinal Data Analysis and Causal Inference in
Microbiome Studies . . . . . . . . . . . . . . . . . . . . . . . . . . . . . . . . 54
3.5.1 Standard Longitudinal Models . . . . . . . . . . . . . . . . . . . 54
3.5.2 Newly Developed Over-Dispersed and Zero-Inflated
Longitudinal Models. . . . . . . . . . . . . . . . . . . . . . . . . . 55
3.5.3 Regression-Based Time Series Models. . . . . . . . . . . . . 57
3.5.4 Detecting Causality: Causal Inference
and Mediation Analysis of Microbiome Data . . . . . . . . 59
3.5.5 Meta-analysis of Microbiome Data . . . . . . . . . . . . . . . 60
3.6 Introduction of Statistical Packages . . . . . . . . . . . . . . . . . . . . . 62
3.7 Limitations of Existing Statistical Methods and Future
Development . . . . . . . . . . . . . . . . . . . . . . . . . . . . . . . . . . . . . 64
References . . . . . . . . . . . . . . . . . . . . . . . . . . . . . . . . . . . . . . . . . . . . 66
4 Introduction to R, RStudio and ggplot2 . . . . . . . . . . . . . . . . . . . . . 77
4.1 Introduction to R and RStudio . . . . . . . . . . . . . . . . . . . . . . . . . 77
4.1.1 Installing R, RStudio, and R Packages . . . . . . . . . . . . . 78
4.1.2 Set Working Directory in R . . . . . . . . . . . . . . . . . . . . 79
4.1.3 Data Analysis Through RStudio . . . . . . . . . . . . . . . . . 80
4.1.4 Data Import and Export . . . . . . . . . . . . . . . . . . . . . . . 83
4.1.5 Basic Data Manipulation . . . . . . . . . . . . . . . . . . . . . . . 87
4.1.6 Simple Summary Statistics . . . . . . . . . . . . . . . . . . . . . 93
4.1.7 Other Useful R Functions . . . . . . . . . . . . . . . . . . . . . . 95
4.2 Introduction to the dplyr Package . . . . . . . . . . . . . . . . . . . . . . 102
4.3 Introduction to ggplot2 . . . . . . . . . . . . . . . . . . . . . . . . . . . . . . 110
4.3.1 ggplot2 and the Grammar of Graphics . . . . . . . . . . . . . 110
4.3.2 Simplify Specifications in Creating a Plot Using
ggplot() . . . . . . . . . . . . . . . . . . . . . . . . . . . . . . . . . . . 112
4.3.3 Creating a Plot Using ggplot() . . . . . . . . . . . . . . . . . . 115
4.4 Summary . . . . . . . . . . . . . . . . . . . . . . . . . . . . . . . . . . . . . . . . 127
References . . . . . . . . . . . . . . . . . . . . . . . . . . . . . . . . . . . . . . . . . . . . 127
5 Power and Sample Size Calculations for Microbiome Data . . . . . . 129
5.1 Hypothesis Testing and Power Analysis . . . . . . . . . . . . . . . . . . 129
5.1.1 Hypothesis Testing . . . . . . . . . . . . . . . . . . . . . . . . . . . 129
5.1.2 Power Analysis and Sample Size Calculation . . . . . . . . 132
5.2 Power Analysis for Testing Differences in Diversity
Using T-Test . . . . . . . . . . . . . . . . . . . . . . . . . . . . . . . . . . . . . 134
5.2.1 Power Formula for Continuous Outcome . . . . . . . . . . . 134
5.2.2 Diversity Data for ALS Study . . . . . . . . . . . . . . . . . . . 137
5.2.3 Calculating Power or Sample Size Using R Function
power.t.test() . . . . . . . . . . . . . . . . . . . . . . . . . . . . . . . 140
5.3 Power Analysis for Comparing Diversity Across More
than Two Groups Using ANOVA . . . . . . . . . . . . . . . . . . . . . . 143
5.3.1 Hypothesis and Theory of Power for One-Way
ANOVA . . . . . . . . . . . . . . . . . . . . . . . . . . . . . . . . . . 143
5.3.2 Calculating Power or Sample Size Using R Function
pwr.avova.test() . . . . . . . . . . . . . . . . . . . . . . . . . . . . . 144
5.4 Power Analysis for Comparing a Taxon of Interest Across
Groups . . . . . . . . . . . . . . . . . . . . . . . . . . . . . . . . . . . . . . . . . . 146
5.4.1 Hypothesis and Basic Power and Sample Size
Formulas for Comparing Proportions . . . . . . . . . . . . . . 146
5.4.2 Power Analysis Using R Function
power.prop.test() . . . . . . . . . . . . . . . . . . . . . . . . . . . . 147
5.4.3 Power Analysis Using v2 Test and Fisher
Exact Test . . . . . . . . . . . . . . . . . . . . . . . . . . . . . . . . . 150
5.5 Comparing the Frequency of All Taxa Across Groups
Using Dirichlet-Multinomial Model . . . . . . . . . . . . . . . . . . . . . 154
5.5.1 Multivariate Hypothesis Testing
and Dirichlet-Multinomial Model . . . . . . . . . . . . . . . . 154
5.5.2 Power and Sample Size Calculations Under Dirichlet-
Multinomial Model. . . . . . . . . . . . . . . . . . . . . . . . . . . 155
5.5.3 Power and Size Calculations Using HMP Package . . . . 157
5.5.4 Effect Size Calculation Using HMP Package . . . . . . . . 164
5.6 Summary . . . . . . . . . . . . . . . . . . . . . . . . . . . . . . . . . . . . . . . . 165
References . . . . . . . . . . . . . . . . . . . . . . . . . . . . . . . . . . . . . . . . . . . . 165
6 Community Diversity Measures and Calculations . . . . . . . . . . . . . . 167
6.1 Vdr−/− Mice Data Set . . . . . . . . . . . . . . . . . . . . . . . . . . . . . . . 167
6.2 Introduction to Community Diversities . . . . . . . . . . . . . . . . . . . 167
6.2.1 Alpha Diversity . . . . . . . . . . . . . . . . . . . . . . . . . . . . . 168
6.2.2 Beta Diversity . . . . . . . . . . . . . . . . . . . . . . . . . . . . . . 168
6.2.3 Gamma Diversity . . . . . . . . . . . . . . . . . . . . . . . . . . . . 169
6.3 Alpha Diversity Measures and Calculations . . . . . . . . . . . . . . . 169
6.3.1 Chao 1 Richness Index and Number of Taxa . . . . . . . . 169
6.3.2 Shannon-Wiener Diversity Index . . . . . . . . . . . . . . . . . 173
6.3.3 Simpson Diversity Index. . . . . . . . . . . . . . . . . . . . . . . 174
6.3.4 Pielou’s Evenness Index . . . . . . . . . . . . . . . . . . . . . . . 177
6.3.5 Make a Dataframe of Diversity Indices . . . . . . . . . . . . 178
6.4 Beta Diversity Measures and Calculations . . . . . . . . . . . . . . . . 180
6.4.1 Binary Similarity Coefficients: Jaccard
and Sørensen Indices . . . . . . . . . . . . . . . . . . . . . . . . . 182
6.4.2 Distance (Dissimilarity) Coefficients:
Bray-Curtis Index . . . . . . . . . . . . . . . . . . . . . . . . . . . . 186
6.5 Summary . . . . . . . . . . . . . . . . . . . . . . . . . . . . . . . . . . . . . . . . 189
References . . . . . . . . . . . . . . . . . . . . . . . . . . . . . . . . . . . . . . . . . . . . 189
7 Exploratory Analysis of Microbiome Data and Beyond . . . . . . . . . 191
7.1 Datasets from Mice and Human. . . . . . . . . . . . . . . . . . . . . . . . 191
7.1.1 Vdr−/− Mice Data Set . . . . . . . . . . . . . . . . . . . . . . . . . 191
7.1.2 Cigarette Smokers Data Set. . . . . . . . . . . . . . . . . . . . . 191
7.2 Exploratory Analysis with Graphic Summary . . . . . . . . . . . . . . 192
7.2.1 Plot Richness . . . . . . . . . . . . . . . . . . . . . . . . . . . . . . . 192
7.2.2 Plot Abundance Bar . . . . . . . . . . . . . . . . . . . . . . . . . . 193
7.2.3 Plot Heatmap . . . . . . . . . . . . . . . . . . . . . . . . . . . . . . . 195
7.2.4 Plot Network . . . . . . . . . . . . . . . . . . . . . . . . . . . . . . . 197
7.2.5 Plot Phylogenetic Tree . . . . . . . . . . . . . . . . . . . . . . . . 199
7.3 Clustering. . . . . . . . . . . . . . . . . . . . . . . . . . . . . . . . . . . . . . . . 202
7.3.1 Introduction to Clustering, Distance
and Ordination . . . . . . . . . . . . . . . . . . . . . . . . . . . . . . 202
7.3.2 Clustering . . . . . . . . . . . . . . . . . . . . . . . . . . . . . . . . . 204
7.4 Ordination . . . . . . . . . . . . . . . . . . . . . . . . . . . . . . . . . . . . . . . 208
7.4.1 Principal Component Analysis (PCA) . . . . . . . . . . . . . 209
7.4.2 Principal Coordinate Analysis (PCoA) . . . . . . . . . . . . . 214
7.4.3 Non-metric Multidimensional Scaling (NMDS) . . . . . . 220
7.4.4 Correspondence Analysis (CA) . . . . . . . . . . . . . . . . . . 223
7.4.5 Redundancy Analysis (RDA) . . . . . . . . . . . . . . . . . . . 227
7.4.6 Constrained Correspondence Analysis (CCA). . . . . . . . 236
7.4.7 Constrained Analysis of Principal Coordinates
(CAP) . . . . . . . . . . . . . . . . . . . . . . . . . . . . . . . . . . . . 243
7.5 Summary and Discussion . . . . . . . . . . . . . . . . . . . . . . . . . . . . 248
References . . . . . . . . . . . . . . . . . . . . . . . . . . . . . . . . . . . . . . . . . . . . 249
8 Univariate Community Analysis . . . . . . . . . . . . . . . . . . . . . . . . . . . 251
8.1 Comparisons of Diversities Between Two Groups. . . . . . . . . . . 251
8.1.1 Two-Sample Welch’s t-Test . . . . . . . . . . . . . . . . . . . . 251
8.1.2 Wilcoxon Rank Sum Test . . . . . . . . . . . . . . . . . . . . . . 254
8.2 Comparisons of a Taxon of Interest Between Two Groups . . . . 256
8.2.1 Comparison of Relative Abundance Using
Wilcoxon Rank Sum Test . . . . . . . . . . . . . . . . . . . . . . 256
8.2.2 Comparison of Present or Absent Taxon
Using Chi-Square Test . . . . . . . . . . . . . . . . . . . . . . . . 260
8.3 Comparisons Among More than Two Groups
Using ANOVA . . . . . . . . . . . . . . . . . . . . . . . . . . . . . . . . . . . . 264
8.3.1 One-Way ANOVA . . . . . . . . . . . . . . . . . . . . . . . . . . . 264
8.3.2 Pairwise and Tukey Multiple Comparisons . . . . . . . . . 270
8.4 Comparisons Among More than Two Groups
Using Kruskal-Wallis Test . . . . . . . . . . . . . . . . . . . . . . . . . . . . 273
8.4.1 Kruskal-Wallis Test . . . . . . . . . . . . . . . . . . . . . . . . . . 273
8.4.2 Compare Diversities Among Groups . . . . . . . . . . . . . . 274
8.4.3 Find Significant Taxa Among Groups . . . . . . . . . . . . . 277
8.4.4 Multiple Testing and E-value, FWER and FDR . . . . . . 278
8.5 Summary . . . . . . . . . . . . . . . . . . . . . . . . . . . . . . . . . . . . . . . . 281
References . . . . . . . . . . . . . . . . . . . . . . . . . . . . . . . . . . . . . . . . . . . . 282
9 Multivariate Community Analysis. . . . . . . . . . . . . . . . . . . . . . . . . . 285
9.1 Hypothesis Testing Among Groups Using Permutational
Multivariate Analysis of Variance (PERMANOVA) . . . . . . . . . 285
9.1.1 Introduction of PERMANOVA . . . . . . . . . . . . . . . . . . 285
9.1.2 Implementing PERMANOVA Using
Vegan Package. . . . . . . . . . . . . . . . . . . . . . . . . . . . . . 288
9.1.3 Implementing Pairwise Permutational MANOVA
Using RVAideMemoire Package . . . . . . . . . . . . . . . . . 297
9.1.4 Test Group Homogeneities Using the Function
betadisper() . . . . . . . . . . . . . . . . . . . . . . . . . . . . . . . . 301
9.2 Hypothesis Tests Among Group-Differences Using Mantel
Test (MANTEL) . . . . . . . . . . . . . . . . . . . . . . . . . . . . . . . . . . . 304
9.2.1 Introduction of Mantel and Partial Mantel Tests
for Dissimilarity Matrices . . . . . . . . . . . . . . . . . . . . . . 304
9.2.2 Illustrating Mantel Test Using Vegan Package . . . . . . . 306
9.3 Hypothesis Tests Among-Group Differences
Using ANOSIM . . . . . . . . . . . . . . . . . . . . . . . . . . . . . . . . . . . 311
9.3.1 Introduction of Analysis of Similarity
(ANOSIM). . . . . . . . . . . . . . . . . . . . . . . . . . . . . . . . . 311
9.3.2 Illustrating Analysis of Similarity (ANOSIM)
Using Vegan Package . . . . . . . . . . . . . . . . . . . . . . . . . 313
9.4 Hypothesis Tests of Multi-response Permutation Procedures
(MRPP) . . . . . . . . . . . . . . . . . . . . . . . . . . . . . . . . . . . . . . . . . 316
9.4.1 Introduction of MRPP . . . . . . . . . . . . . . . . . . . . . . . . 316
9.4.2 Illustrating MRPP Using Vegan Package . . . . . . . . . . . 317
9.5 Compare Microbiome Communities Using the GUniFrac
Package . . . . . . . . . . . . . . . . . . . . . . . . . . . . . . . . . . . . . . . . . 320
9.5.1 Introduction to UniFrac, Weighted UniFrac
and Generalized UniFrac Distance Metrics . . . . . . . . . . 320
9.5.2 Breast Milk Data Set . . . . . . . . . . . . . . . . . . . . . . . . . 322
9.5.3 Comparing Microbiome Communities Using
the GUniFrac Package . . . . . . . . . . . . . . . . . . . . . . . . 323
9.6 Summary and Discussion . . . . . . . . . . . . . . . . . . . . . . . . . . . . 327
References . . . . . . . . . . . . . . . . . . . . . . . . . . . . . . . . . . . . . . . . . . . . 329
10 Compositional Analysis of Microbiome Data . . . . . . . . . . . . . . . . . 331
10.1 Introduction to Compositional Analysis . . . . . . . . . . . . . . . . . . 331
10.1.1 What Are Compositional Data? . . . . . . . . . . . . . . . . . . 331
10.1.2 Aitchison Simplex . . . . . . . . . . . . . . . . . . . . . . . . . . . 332
10.1.3 Problems with Standard Statistical Methods . . . . . . . . . 332
10.1.4 Statistical Analysis of Compositional Data . . . . . . . . . . 334
10.2 Why Microbiome Dataset Can Be Treated
as Compositional? . . . . . . . . . . . . . . . . . . . . . . . . . . . . . . . . . . 347
10.3 Exploratory Compositional Data Analysis . . . . . . . . . . . . . . . . 349
10.3.1 Compositional Biplot . . . . . . . . . . . . . . . . . . . . . . . . . 349
10.3.2 Compositional Scree Plot . . . . . . . . . . . . . . . . . . . . . . 356
10.3.3 Compositional Cluster Dendrogram . . . . . . . . . . . . . . . 357
10.3.4 Compositional Barplot . . . . . . . . . . . . . . . . . . . . . . . . 358
10.4 Comparison Between the Groups Using ALDEx2 Package . . . . 361
10.4.1 Vdr Data Set of Fecal and Cecal Sites . . . . . . . . . . . . . 361
10.4.2 Compositional Data Analysis Using ALDEx2 . . . . . . . 361
10.4.3 Difference Plot, Effect Size and Effect Plot . . . . . . . . . 368
10.5 Proportionality: Correlation Analysis for Relative Data . . . . . . . 371
10.5.1 Correlation Analysis Is Not Appropriate for
Compositional Data . . . . . . . . . . . . . . . . . . . . . . . . . . 371
10.5.2 Introduction to Proportionality. . . . . . . . . . . . . . . . . . . 373
10.5.3 Illustrating Proportionality Analysis . . . . . . . . . . . . . . . 375
10.6 Summary and Discussion . . . . . . . . . . . . . . . . . . . . . . . . . . . . 389
References . . . . . . . . . . . . . . . . . . . . . . . . . . . . . . . . . . . . . . . . . . . . 389
11 Modeling Over-Dispersed Microbiome Data . . . . . . . . . . . . . . . . . . 395
11.1 Count-Based Differential Abundance Analysis
of Microbiome Data . . . . . . . . . . . . . . . . . . . . . . . . . . . . . . . . 395
11.1.1 Biological and Technical Variations . . . . . . . . . . . . . . 396
11.1.2 Poisson Model . . . . . . . . . . . . . . . . . . . . . . . . . . . . . . 397
11.1.3 Negative Binomial Model . . . . . . . . . . . . . . . . . . . . . . 400
11.2 NB Model in edgeR . . . . . . . . . . . . . . . . . . . . . . . . . . . . . . . . 400
11.2.1 Development of NB in the Setting of Genomic
Count Data . . . . . . . . . . . . . . . . . . . . . . . . . . . . . . . . 400
11.2.2 Dispersion Estimators of NB in edgeR . . . . . . . . . . . . 401
11.2.3 Hypothesis Testing in edgeR. . . . . . . . . . . . . . . . . . . . 403
11.3 The edgeR Package . . . . . . . . . . . . . . . . . . . . . . . . . . . . . . . . 405
11.3.1 Introduction . . . . . . . . . . . . . . . . . . . . . . . . . . . . . . . . 405
11.3.2 Step-by-Step Implementing edgeR. . . . . . . . . . . . . . . . 408
11.4 NB Model in DESeq and DESeq2 . . . . . . . . . . . . . . . . . . . . . . 424
11.4.1 NB Model in DESeq . . . . . . . . . . . . . . . . . . . . . . . . . 424
11.4.2 NB Model in DESeq2 . . . . . . . . . . . . . . . . . . . . . . . . 425
11.5 The DESeq and DESeq2 Packages. . . . . . . . . . . . . . . . . . . . . . 427
11.5.1 Introduction . . . . . . . . . . . . . . . . . . . . . . . . . . . . . . . . 427
11.5.2 Step-by-Step Implementing DESeq2 . . . . . . . . . . . . . . 428
11.6 Summary and Discussion . . . . . . . . . . . . . . . . . . . . . . . . . . . . 448
References . . . . . . . . . . . . . . . . . . . . . . . . . . . . . . . . . . . . . . . . . . . . 449
12 Modeling Zero-Inflated Microbiome Data . . . . . . . . . . . . . . . . . . . . 453
12.1 Introduction . . . . . . . . . . . . . . . . . . . . . . . . . . . . . . . . . . . . . . 453
12.2 Zero-Inflated Models: ZIP and ZINB . . . . . . . . . . . . . . . . . . . . 454
12.2.1 ZIP Model . . . . . . . . . . . . . . . . . . . . . . . . . . . . . . . . . 455
12.2.2 ZINB Model . . . . . . . . . . . . . . . . . . . . . . . . . . . . . . . 456
12.2.3 Modeling Using ZIP and ZINB . . . . . . . . . . . . . . . . . . 457
12.3 Zero-Hurdle Models: ZHP and ZHNB . . . . . . . . . . . . . . . . . . . 465
12.3.1 ZHP Model . . . . . . . . . . . . . . . . . . . . . . . . . . . . . . . . 466
12.3.2 ZHNB Model . . . . . . . . . . . . . . . . . . . . . . . . . . . . . . . 467
12.3.3 Modeling ZHP and ZHNB . . . . . . . . . . . . . . . . . . . . . 468
12.3.4 Comparing Zero-Inflated and Zero-Hurdle Models . . . . 471
12.3.5 Interpreting Main Effects of Modeling Results . . . . . . . 477
12.3.6 Multiple Testing Issue and Adjusting P-Values . . . . . . 480
12.4 Zero-Inflated Beta Regression Model with Random Effects . . . . 481
12.4.1 Introduction . . . . . . . . . . . . . . . . . . . . . . . . . . . . . . . . 481
12.4.2 ZIBR Model . . . . . . . . . . . . . . . . . . . . . . . . . . . . . . . 481
12.4.3 Hypothesis Testing of ZIBR . . . . . . . . . . . . . . . . . . . . 482
12.4.4 Modeling Using ZIBR . . . . . . . . . . . . . . . . . . . . . . . . 483
12.5 Summary and Discussion . . . . . . . . . . . . . . . . . . . . . . . . . . . . 494
References . . . . . . . . . . . . . . . . . . . . . . . . . . . . . . . . . . . . . . . . . . . . 494
Index . . . . . . . . . . . . . . . . . . . . . . . . . . . . . . . . . . . . . . . . . . . . . . . . . . . . . . 497
· · · · · · (收起)
读后感
用户评价
我是一名生物信息学方向的研究员,我的主要工作是开发和优化分析流程,以支持各种组学数据的分析。微生物组数据,尤其是涉及多组学整合分析时,其复杂性更是令人头疼。我期望这本书能够提供一套权威且全面的R语言在微生物组数据分析中的应用指南。我非常关注书中是否会涵盖如何进行不同组学数据(例如,微生物基因组、宏转录组、代谢组)之间的整合分析,以及如何利用R来实现这些整合分析的统计学方法。例如,如何识别不同组学层面的关联模式,如基因表达与代谢产物之间的关系,或者微生物群落结构与环境因素之间的关联?我特别希望书中能够提供关于如何构建和评估多组学数据分析模型的详细说明,并给出相应的R代码实现。此外,对于那些需要进行大规模数据集分析的研究,书中是否会涉及到高性能计算环境下的R语言应用,比如如何并行计算,如何优化内存使用,以提高分析效率?这本书如果能提供这些内容,无疑将极大地提升我处理复杂微生物组研究项目的能力,并可能激发我开发新的整合分析工具。
这本书对我来说,简直就是打开了新世界的大门。我是一名正在攻读博士学位的学生,我的研究方向涉及肠道微生物组与宿主免疫系统的相互作用。在我的研究过程中,经常需要处理高维度的微生物组成数据,并尝试找出与特定免疫表型相关的微生物特征。过去,我尝试过使用一些通用的统计软件,但往往难以捕捉到微生物组数据的特有属性,比如它的高维性、稀疏性和非正态分布的特点。而R语言,我相信是处理这类数据的最佳选择。我特别期待这本书能够提供一套系统性的方法论,从数据的质量控制、标准化,到不同类型的微生物数据(如16S rRNA,宏基因组,宏转录组)的差异化分析策略。比如,对于16S rRNA数据,书中是否会详细介绍如何进行OTU聚类、分类学注释,以及如何根据不同的研究目的,选择恰当的α多样性和β多样性指数?对于宏基因组数据,又是否会讲解基因家族分析、代谢通路分析等?我非常希望书中能提供清晰的步骤和代码示例,让我能够一步一步地学会如何使用R来实现这些分析,从而更有效地回答我的研究问题,比如“哪些微生物群落在特定免疫状态下显著富集或缺失?”,以及“这些微生物的功能变化与免疫信号之间是否存在关联?”。
作为一个对生命科学充满好奇的本科生,我对微生物组这个领域充满了浓厚的兴趣,但统计学分析一直是我的一个痛点。每当看到文献中那些复杂的图表和统计结果,都感到一头雾水。这本书的出现,让我看到了一个学习的机会。我尤其希望书中能够从最基础的概念讲起,比如什么是统计学在微生物组研究中的意义,为什么需要R语言来处理这些数据。我希望它能用最通俗易懂的语言,讲解一些基础的统计概念,比如p值、置信区间、假设检验等,并解释它们在微生物组数据分析中的具体含义。然后,循序渐进地引导我学习如何使用R来完成这些基本分析,比如如何导入和查看数据、如何进行描述性统计、如何绘制基本的图表来可视化微生物群落的组成和变化。我期待书中能有大量的图文并茂的解释,让我能够直观地理解每一步操作的意义,并能够将学到的知识应用到我可能参与的简单微生物组分析项目中。这本书对我而言,不仅仅是一本技术书,更是一个入门的向导,让我能够克服对统计学的恐惧,勇敢地迈入微生物组研究的大门。
我是一名对微生物组数据分析的自动化和可重复性非常重视的研究人员。在我的工作中,我经常需要处理大量重复性的分析任务,并且需要确保我的分析结果是可重复的。这本书的出现,让我看到了希望。我尤其期待书中能够深入讲解如何使用R语言来实现微生物组数据分析流程的自动化。例如,是否会介绍如何使用R Markdown来整合代码、结果和文字,生成易于分享和报告的分析文档?我非常希望书中能提供关于如何使用R包(如`tidyverse`系列)来简化和优化数据处理和分析的步骤,从而提高代码的可读性和可维护性。此外,对于需要进行模型验证和参数调优的场景,书中是否会介绍交叉验证、网格搜索等机器学习中常用的技术,并提供相应的R语言实现?我更希望书中能够涵盖如何进行R包的开发和管理,以及如何利用版本控制工具(如Git)来管理我的分析代码,确保研究的可重复性。这本书如果能提供这些关于自动化和可重复性分析的实践指导,将极大地提升我进行高效、可靠的微生物组数据分析的能力。
我一直对微生物组数据的多样性与复杂性感到着迷,但每次尝试用统计学方法去深入解析时,总会遇到瓶颈。许多现有的教材往往停留在概念层面,缺乏实际操作的指导,或者代码示例过于晦涩难懂,难以迁移到自己的数据上。这本书的标题“Statistical Analysis of Microbiome Data with R”立刻吸引了我,因为它承诺将统计学原理与R语言的实践相结合,这正是我所急需的。我尤其关注书中是否会详细讲解如何进行序列变异的统计推断,例如在群体遗传学研究中,如何利用R来评估不同微生物群落之间的基因流、选择压力等。此外,对于网络分析,即如何构建和解释微生物之间的相互作用网络,我也充满了期待。书中能否提供关于网络拓扑属性的计算方法,以及如何评估网络稳定性、模块化等关键指标?更进一步,我希望它能涵盖一些前沿的统计模型,比如基于贝叶斯方法的推断,或者机器学习在微生物组分类、预测疾病风险等方面的应用。如果书中能详细解释这些方法的生物学意义,并提供可执行的R代码,那将是对我研究的巨大推动。我希望这本书不仅仅是一本技术手册,更能启发我对微生物组生态学更深层次的理解。
作为一名在药物研发领域工作的科学家,我对利用微生物组数据来预测药物疗效、评估药物副作用以及发现新的药物靶点充满了兴趣。处理临床样本产生的微生物组数据,其数据的复杂性和维度之高,对我而言是一个巨大的挑战。这本书的标题“Statistical Analysis of Microbiome Data with R”引起了我的高度关注,因为它承诺将统计分析与R语言结合,这正是我所需要的。我特别希望书中能够详细讲解如何利用R来进行微生物组与临床表型之间的关联分析,比如如何设计和执行样本量计算,如何进行数据标准化和特征选择,以及如何运用适当的统计模型(如逻辑回归、生存分析、机器学习模型)来识别与药物响应相关的微生物标志物。我非常期待书中能提供关于如何进行因果推断的统计学方法,以初步判断微生物与疾病或药物疗效之间的因果关系。此外,对于临床试验中的微生物组数据,书中是否会涵盖如何处理混合效应模型、如何进行亚组分析,以及如何进行多重检验校正等内容?这本书如果能提供这些在临床研究中至关重要的统计学工具和方法,将极大地帮助我从海量的微生物组数据中提取有价值的信息,从而加速药物研发的进程。
我对微生物组研究中的统计学方法,特别是关于微生物群落的比较分析,一直抱有浓厚的兴趣。但许多现有的教材往往只停留在理论层面,缺乏实际操作的指导,或者代码示例过于晦涩难懂。这本书的出现,让我看到了一个机会。我特别期待书中能够详细讲解如何使用R来执行各种微生物群落的比较分析。例如,在比较不同处理组或不同环境条件下微生物群落的差异时,书中是否会提供关于如何进行β多样性分析的详细步骤,包括各种距离度量(如Bray-Curtis, Jaccard)的选择,以及如何利用PERMANOVA等非参数检验来评估组间差异的显著性?我非常希望书中能提供关于如何进行多组比较的统计学方法,比如如何使用R来进行ANOVA或Kruskal-Wallis检验来比较多个处理组的α多样性,以及如何进行事后检验来找出具体哪些组之间存在显著差异。更进一步,我希望书中能涵盖如何使用R来分析微生物群落的组成与环境因子之间的关系,比如如何构建冗余分析(RDA)或典型相关分析(CCA),以揭示驱动群落变化的关键环境因子。这本书如果能提供清晰的代码示例和深入的统计学解释,将极大地提升我处理和分析微生物群落比较数据的能力。
这本书简直是为我量身定做的!作为一个在微生物组研究领域摸爬滚打多年的科研人员,我一直被海量的宏基因组、16S rRNA测序数据压得喘不过气来。那些复杂的统计模型,尤其是涉及到非参数检验、多样性指数计算、物种丰度差异分析以及各种降维和聚类方法的应用,常常让我感到力不从心。而R语言,虽然我早已耳闻其强大之处,但真正拿起它来分析如此庞杂且具有生物学特殊性的数据,却始终是一道难以逾越的门槛。这本书的出现,无疑是一场及时雨。我尤其期待它能够深入浅出地讲解如何有效地进行数据预处理,比如去除低丰度OTU、处理稀疏性问题,以及如何针对不同的微生物组研究设计(例如配对样本、重复实验)选择合适的统计模型。更重要的是,我希望这本书能提供详尽的代码示例,让我能够直接上手,将理论知识转化为实际操作,从而更高效、更准确地从数据中挖掘出有价值的生物学洞见,为我的研究项目提供坚实的统计学支撑,甚至启发新的研究思路。这本书的出现,让我看到了在浩瀚的微生物组数据海洋中找到航向的希望,仿佛一位经验丰富的向导,将带领我穿越那些看似杂乱无章的数据,最终抵达知识的彼岸。我迫不及待地想深入其中,去学习那些曾经让我头疼不已的统计学原理,并将其转化为强大的数据分析工具,用以解决我工作中遇到的种种挑战。
我是一位对生态学统计模型非常感兴趣的博士后研究员,我的研究领域涉及生态系统中微生物群落的演替和驱动因素。我一直在寻找一本能够将生态学理论与R语言的统计分析方法紧密结合的书籍。这本书的出现,让我看到了希望。我尤其期待书中能够深入讲解如何使用R来构建和检验各种生态学统计模型,以理解微生物群落的动态变化。例如,在群落构建理论方面,书中是否会介绍如何利用R来评估物种的定殖、灭绝、扩散和竞争等过程对群落结构的影响?在群落组装方面,书中是否会提供使用R进行零模型分析、基于模型的模拟等方法,来揭示影响群落组装的主要驱动因素?我非常希望书中能够包含关于如何处理空间自相关、时间序列数据等生态学数据中常见问题的统计学方法,并提供相应的R代码实现。更进一步,我希望书中能探讨如何将微生物组数据与环境因子、宿主因子等进行关联分析,从而揭示微生物群落对外部环境的响应机制。这本书的价值在于,它能帮助我将抽象的生态学理论转化为可量化的统计模型,从而更科学地解释和预测微生物群落的行为。
我对微生物组数据的可视化有着非常高的要求。在科研交流和论文发表中,清晰、直观且具有统计学意义的可视化图表,能够极大地提升研究结果的解读性和影响力。这本书的出现,让我看到了希望。我尤其期待书中能够深入讲解如何使用R来创建各种类型的微生物组数据可视化图表,并且这些图表能够准确地反映统计学分析的结果。例如,如何利用R来绘制能够清晰展示群落结构变化的Ordination图(如PCoA, NMDS),并能在图中标注重要的环境因子或分组信息?如何绘制能够展示微生物物种丰度差异、功能模块富集或缺失的条形图、箱线图、热图,并能在此基础上添加显著性检验的结果?我更希望书中能够提供关于如何创建交互式可视化图表的指导,以便用户能够更深入地探索数据,例如使用Shiny等R包构建Web应用来展示微生物组分析结果。此外,我也对如何利用R来生成符合学术期刊发表要求的、高质量的图形文件(如EPS, PDF格式)感兴趣。这本书如果能够提供丰富且实用的可视化代码示例,并讲解每种图表的统计学意义和适用场景,那将是我科研工作中不可多得的宝藏。